πŸ‘‹ Home πŸ“š Library πŸ“‘ Posts πŸ““ Wiki πŸ—‚οΈ Tables

Search

Pull for commands
πŸ“‘ Posts 2022 11 04
Casey Gollan
β™₯ liked @allison_horst@mastodon.social 4 years ago
Allison Horst  :BlobhajReach: A
Allison Horst :BlobhajReach: @allison_horst@mastodon.social · 4y 🐘

Hi everyone! I recently joined the Observable (https://observablehq.com/) team as a Data Scientist Advocate after a decade as teaching faculty in environmental data science at UC Santa Barbara. I mostly post about data science, #statistics, #rstats, and related feelings, usually through illustrations (library at https://allisonhorst.com/). Sometimes dogs and mountains. I am really excited to see so many pals already here, and excited to meet & learn from you all! πŸ’š

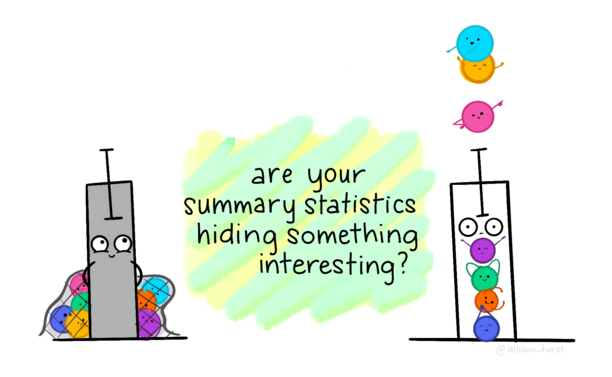
Cartoon with main text: "Are your summary statistics hiding something?" On the left is a opaque gray bar plot with an error bar, looking mischievous while hiding individual data points in a net behind it. On the right is a transparent bar plot with an error bar, looking shocked, with individual data points exposed and dancing. The bottom four data points have arms that spell "YMCA" as if dancing to the Village People.
observablehq.comObservable: Explore and visualize data togetherObservable's collaborative data canvas helps you explore data, perform analysis, and build expressive charts and dashboards.

Loading webmentions…